See What Is Working
Membership, engagement, events, and revenue in one dashboard, drawn from the platform your organization already runs on. Walk into the board meeting with the numbers instead of assembling them the night before.
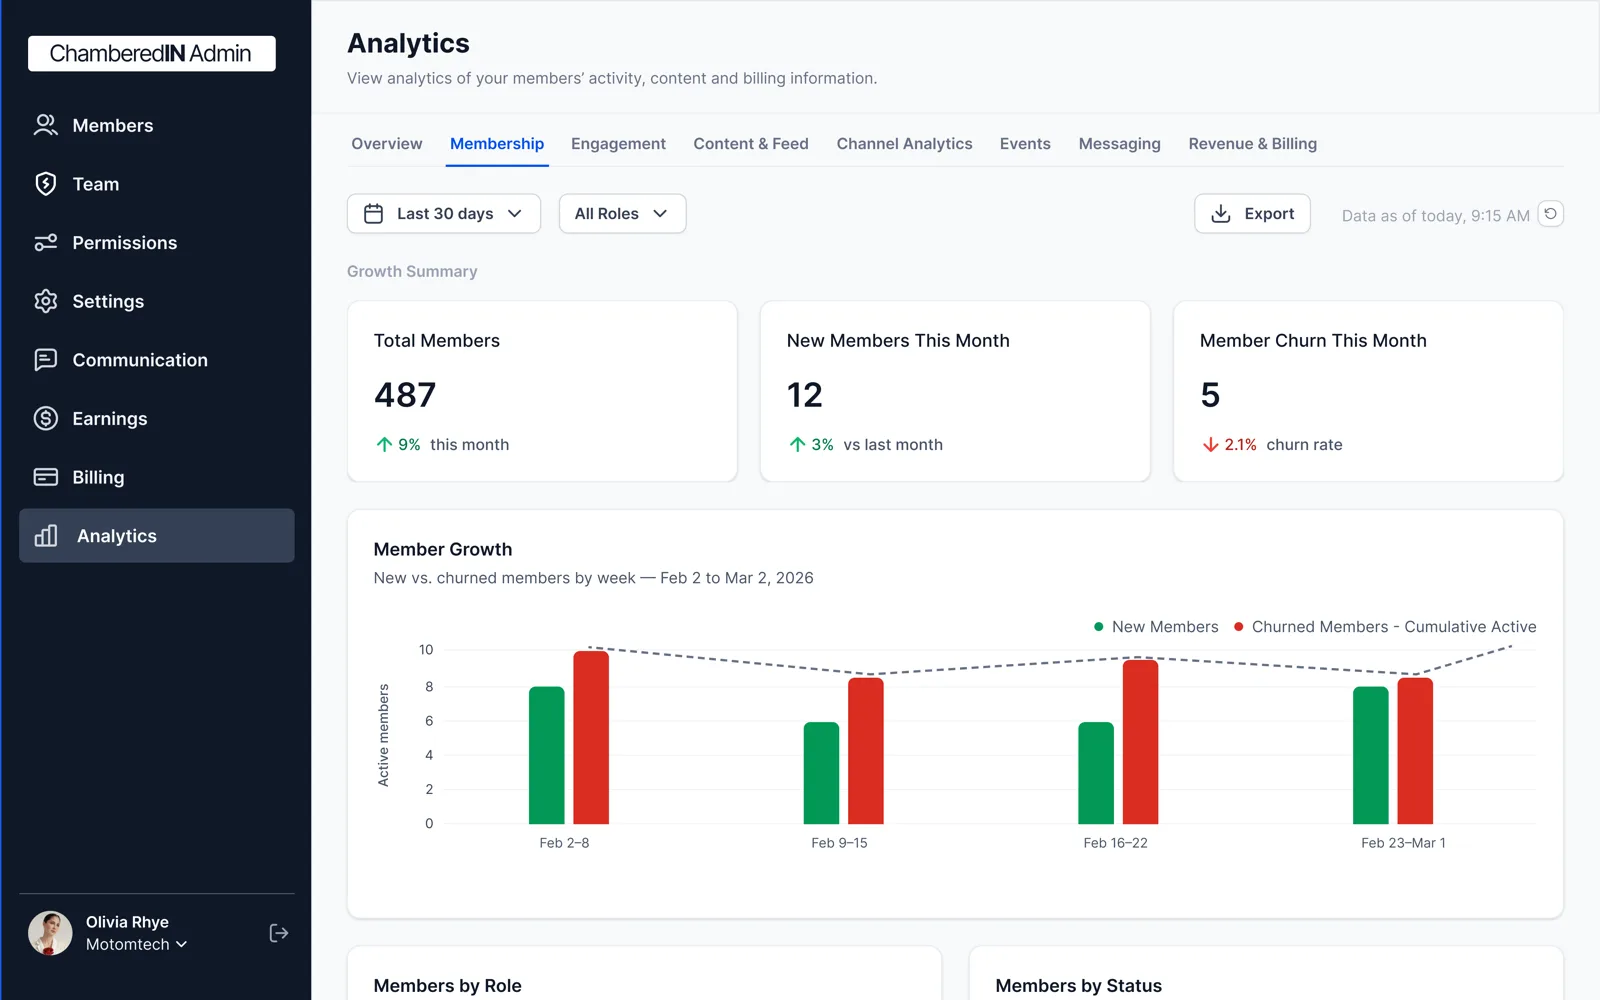
Know Where Membership Stands
Your member count is the first number the board asks about. See how it moves month to month, who joined, who renewed, and who lapsed, without exporting anything into a spreadsheet. A slow slide shows up while it is still a conversation, not yet a budget problem.
- Membership growth over time, with joins, renewals, and lapses.
- Current totals at a glance.
- Trends by month, so the story behind the number is visible.
See What Members Actually Do
Engagement is the earliest signal you get before a renewal decision. See activity across the feed, channels, and the member app, watch it rise after a good event, and notice when it goes quiet. You stop guessing whether members use what they pay for.
- Activity across the feed, channels, and member app.
- Engagement trends over time, not just totals.
- See which parts of the platform members actually use.
Every Event, Measured
See RSVPs and attendance for every event, compare events over time, and learn which formats fill the room. The luncheon that sells out and the mixer that does not both show up plainly, so next quarter's calendar is a decision instead of a habit.
- RSVPs and attendance per event.
- Compare events over time and by type.
- Paid-event revenue sits alongside the attendance numbers.
Dues and Event Revenue, One View
See dues collected and event revenue as they land, and how both are trending. The money already flows through ChamberedIn, from the member plans you set to the tickets you sell, so the revenue picture is a view, not a reconciliation project.
- Dues collected over time.
- Event revenue alongside membership revenue.
- Trends that make the board's revenue question a short answer.
The Rest of What ChamberedIn Runs
Frequently Asked Questions
What does the analytics dashboard cover?
Four views: membership (growth, joins, renewals, lapses), engagement (activity across the feed, channels, and member app), events (RSVPs, attendance, and paid-event revenue), and revenue (dues and event income over time).
Where does the data come from?
From ChamberedIn itself. Your members, events, payments, and communications already live on the platform, so the dashboard reflects the system you actually run. There is nothing to connect and nothing to import.
Do we need someone technical to use it?
No. It is built for the people who run the organization. Open the dashboard and read it; the charts answer the questions boards ask.
Is analytics a separate product or an add-on?
No. Analytics is part of ChamberedIn. We will walk through the dashboard on your demo with numbers like your organization's.
Does this work for associations, not just chambers?
Yes. Membership, engagement, event, and revenue numbers matter to any membership organization, including business associations, professional associations, and networking groups. Chambers are our primary customer, and the dashboard reads the same for all of them.